

GRACE JANG – NOVEMBER 28TH, 2020
EDITOR: PEDRO DE MARCOS
Background
In the face of the continuing pandemic, colleges across the US have adopted various reopening plans for the fall semester. According to the Davidson College’s College Crisis Initiative study reported by The Chronicle, 10% out of nearly 3000 colleges are fully online, 4% are fully in person, 78% are some combination of the two models, and 8% are “other” or undetermined. College reopening models were of particular interest to college students and employees, as we Cal students experienced quite recently, but the idea of colleges as COVID-19 hot spots might also have rendered this issue a matter of life or death for many residents of the college towns.
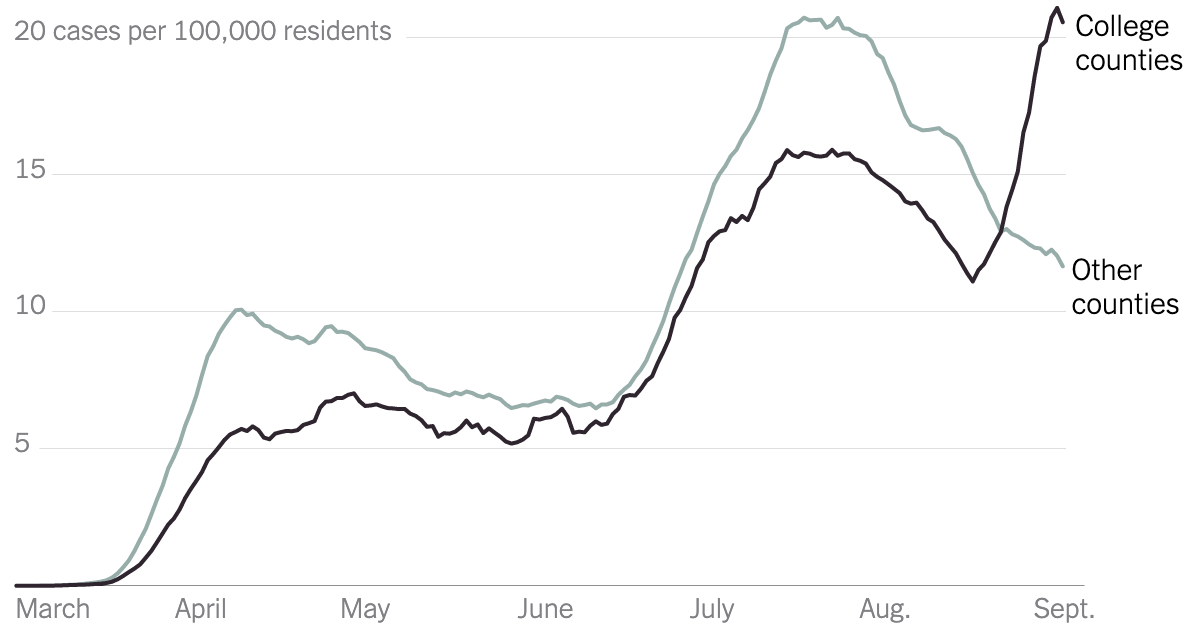
In fact, an increasing number of studies have investigated whether college towns differ from other counties in their COVID-19 rates and have offered a more comprehensive picture on the story. Inside Higher Ed analyzed county-level COVID-19 data running through September 15th and found that counties containing colleges “have been home to the majority of new coronavirus cases detected” since the very beginning of the pandemic, but this was largely due to the large population size of those counties. Adjusting for each county’s population size, counties with a college have actually witnessed fewer new cases per day since August 1st than have counties without a college. On the other hand, according to The New York Times, counties where students comprise at least 10% of the population reported faster increases in COVID cases than did other counties from mid-August to early September, i.e., when most colleges started their fall terms.
Figure 1. New York Times analysis running through early September
Building upon these previous literature, we have conducted a county-level analysis to examine the relationship between the virus infection rate and the presence of a college in a county, as well as the roles of the total number of colleges and the size-adjusted number of colleges in a college town’s infection rate, controlling for each county’s population density.
Method
Our OLS regression models are as follows (COVID refers to cumulative case count until October 25th or % growth of cumulative case counts since September 1st up to October 25th):
- COVID = β0 + β1 * College Town? + ε
- COVID = β0 + β1 * College Town? + β2 * Population Density + ε
- COVID = β0 + β1 * # of Colleges + β2 * Population Density + ε
- COVID = β0 + β1 * Size-adjusted # of Colleges + β2 * Population Density + ε
On our left-hand side, we have either the cumulative COVID-19 case count until October 25th or the total case count in September 1st – October 25th relative to pre-September count, defined as
[(Cum. COVID until 10/25) – (Cum. COVID until 9/1)] / (Cum. COVID until 9/1)].
We use both measures of the coronavirus spread to examine how college towns have fared compared to other counties, both generally since the very beginning of the pandemic and specifically since September 1st. We use the total case counts instead of per-capita rate because population estimates provided by the US Census are only available for the year 2019, and so the estimated per-capita rate which utilizes the 2019 population estimate would be an inaccurate measure of the true rate, especially for counties like college towns that have experienced large fluctuations in resident population since the pandemic’s outbreak. We avoid the possible confounding effect of population density on COVID case count by including population density as a control variable in our regression models, rather than by using per-capita rate for our left-hand side variable. The county-level COVID-19 case counts we use are from the New York Times data repository.
For our right-hand side variables, we have a college town dummy variable to indicate whether a particular county has at least one university within it; its population density in the year 2019; the total number of colleges within the county; and/or the size-adjusted number of colleges within the county. Some of our regression models include all US counties in their sample to compare college towns against non-college-towns, while other models only include college towns to analyze the effect of the total number of colleges and the size-adjusted number of colleges on a college town’s infection rate.
We compute each county’s population density (persons per square mile) by dividing its 2019 population estimate by its land area, both data available on the US Census website. All the college information we use (i.e., the county where each college is located and size classification of each college) was downloaded from the Integrated Postsecondary Education Data System (IPEDS) of the National Center for Education Statistics. IPEDS classifies college size from 1 to 5, with 1 representing a student enrollment of under 1000, 2 representing 1000 – 4999, 3 representing 5000 – 9999, 4 representing 10,000 – 19,999, and 5 representing 20,000 and above. Our size-adjusted number of colleges variable is the sum of the size classification of all universities within a county.
Results
Figure 2. Regression Results Table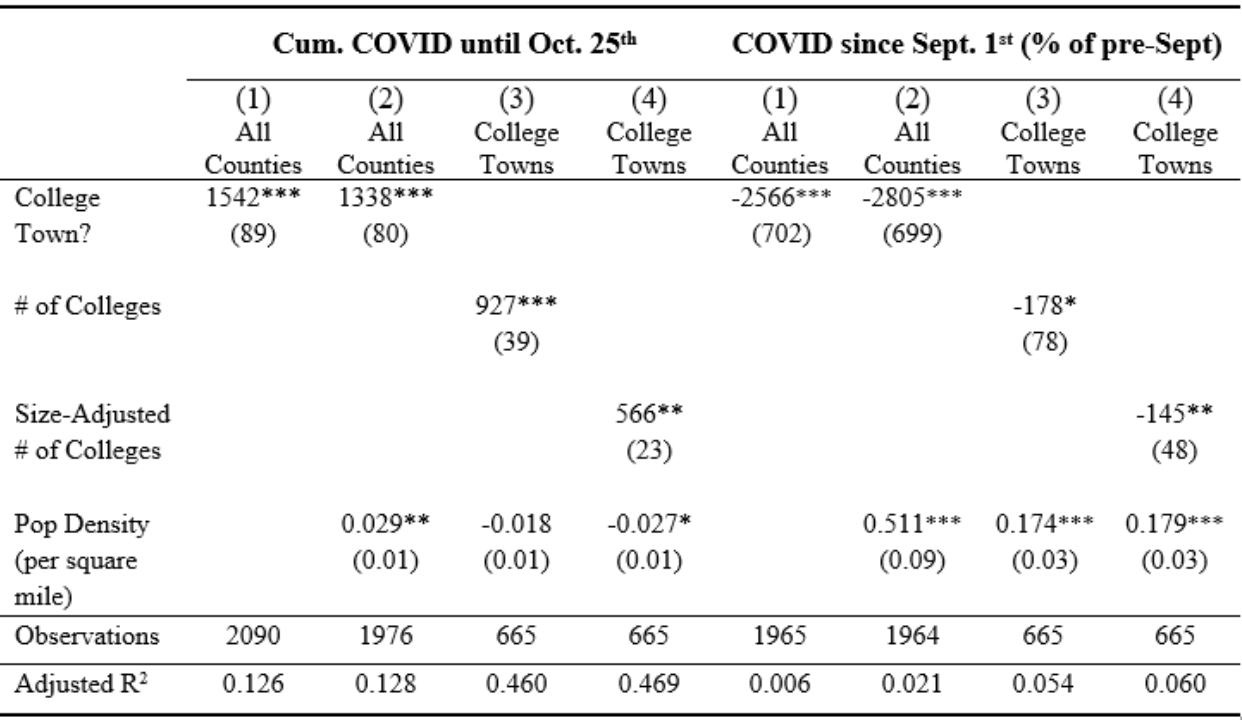
Note: *p <0.05, **p<0.01, ***p<0.001 (Standard error in parenthesis)
As evident from our table, all our results are highly statistically significant except for the coefficient estimate on Population Density in Model 3 of Cumulative COVID. The most striking characteristic of our results is that opposite coefficient signs appear when we regress on cumulative COVID and when we regress on % increase of COVID from before September 1st. When we use cumulative COVID counts as our dependent variable, counties with at least one university have 1542 more cases on average than counties with no university, or 1338 more cases when we control for population density. Among college towns, controlling for population density, every addition of a college is associated with 927 more COVID cases in the county, and every 1-unit increase in the sum of college size classifications is associated with 566 more cases.
In contrast, when we have as our dependent variable COVID case counts in Sept. 1st – Oct. 25th as a percentage of pre-September counts (namely, % growth of COVID from before September), the average % increase in COVID among college towns is 2566 percentage-points lower than the average % increase in COVID among non-college-towns, or 2805 percentage-points lower when controlling for population density. Similarly, when we only look at college towns, % increase in COVID has a negative and statistically significant relationship with the number of colleges and the sum of college size classifications, controlling for population density. Finally, as expected, population density of a county is positively correlated with both the county’s cumulative COVID case counts and % increase in COVID.
Figure 3. Cumulative COVID-19 Case Counts until Oct. 25th, controlling for population density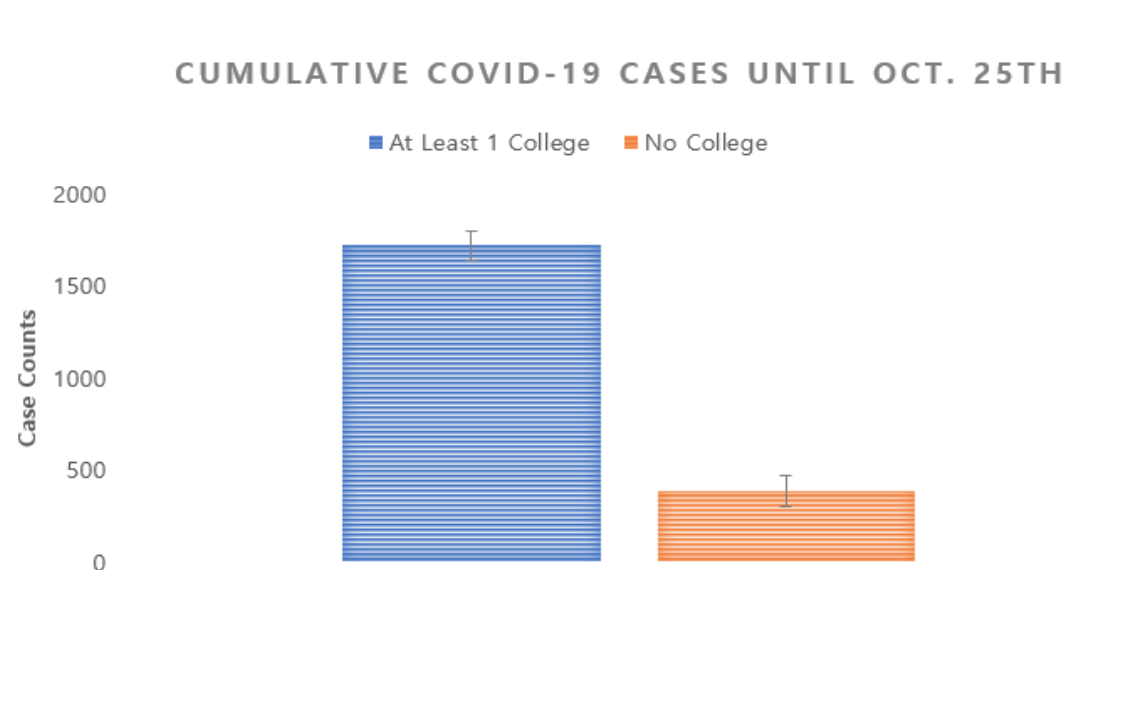
Figure 4. % Increase in COVID-19 Cases from before Sept. 1st, controlling for population density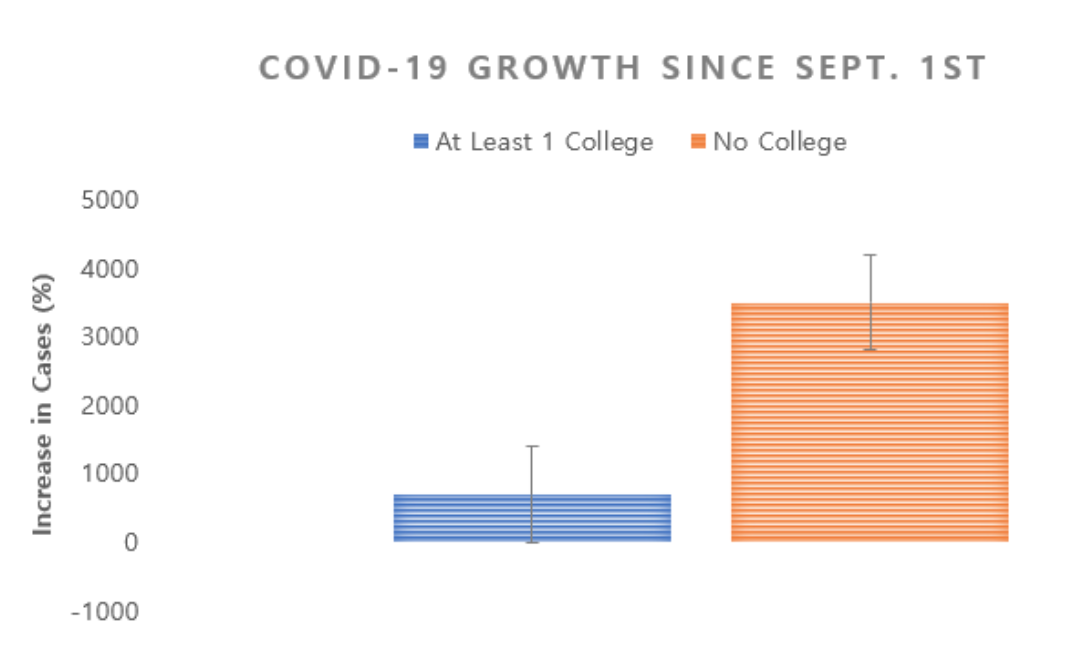
Discussion
The positive association between cumulative COVID case counts and college communities—measured by the presence of at least 1 college, the number of colleges, or the size-adjusted number of colleges— aligns with the conventional notion that college towns are more vulnerable to the pandemic’s spread. This may be due to the heavily crowded environments of college campuses and dormitories and risky behaviors of college students often portrayed by the media, like socializing and partying without regard to social distancing measures.
However, the narrative becomes more complex when we look at how the COVID case counts have changed since September 1st. Contrary to popular expectations, college towns have reported a smaller increase in COVID cases than have counties without a university, and among college towns, COVID growth percentage tended to decrease as the total number of colleges and the size-adjusted number of colleges increased. Considering that most universities across the US have started their fall terms by September 1st, this result may mitigate the common concern that the return of college students and employees to campuses contribute to the infection rate of their surrounding neighborhoods.
One plausible explanation for the divergent results between cumulative COVID and % increase in COVID since September 1st is that university administrations and municipal governments overseeing college towns might better handle public health and safety issues now after many months of the pandemic experience. Furthermore, counties with a college might enforce stricter social distancing policies and other safety measures just because of the popular idea that college communities are more prone to coronavirus infection. Contrast this with the past months where many college towns saw massive spikes in their COVID rates from large-scale outbreaks, and it becomes easier to see why the recent COVID cases relative to the pre-September cases are lower in college towns than in other counties.
Conclusion
To properly investigate whether a reopening of college campuses affects the area’s infection rate, college campuses that have reopened need to be compared with those that have remained closed. Though excluded from our article, we failed to yield a statistically significant result when we regressed COVID-19 case count on a dummy variable of whether a college fully reopened. This is probably because of the small number of fully-reopened schools. A statistically more interesting result may emerge if fully-reopened and mostly-reopened schools are compared against mostly-online and fully-online schools.
Nevertheless, the reversal in the direction of the relationship between college towns and COVID-19 spread over time most likely reflects that college reopening in the fall term are not contributing as much to local virus transmission as commonly thought. In the end, colleges may not be entirely to blame for the pandemic’s spread in the recent months, despite the popular image of colleges as COVID-19 danger zones—an image that has been reinforced by media outlets like The New York Times. An alternative approach to handling COVID-19 might be—instead of pointing fingers at college students — providing college communities and neighborhoods with safety equipment, virus testing, and appropriate sanctions that are necessary for combatting the pandemic effectively.
Featured Image Source: Fire
Disclaimer: The views published in this journal are those of the individual authors or speakers and do not necessarily reflect the position or policy of Berkeley Economic Review staff, the Undergraduate Economics Association, the UC Berkeley Economics Department and faculty, or the University of California, Berkeley in general.