
KONNOR VON EMSTER – OCTOBER 1ST, 2020
EDITOR: CHAZEL HAKIM
Introduction
Last February, Berkeley Economic Review (BER) reported on the potential economic consequences of the novel coronavirus, also known as COVID-19. At that point, COVID-19 was just an epidemic, localized to China and a few neighboring countries with small case loads. Nobody anticipated that the disease would turn the entire world upside down and consequently pressure test many sacred traditions of social, economic, and political discourse. Looking now at the US, it is obvious that much has changed in the past seven months. When we last reported on the coronavirus, the US had zero cases, and many expected the virus to be contained before crossing seas. But since COVID-19 reached US shores, life has inexplicably changed. Barring the pandemic-related loss of social life, recreation, and travel, the US has also experienced massive fires, intense storms, extreme heat waves, and a sweeping racial justice movement, which has led many to wonder what else 2020 has in store.
This article will not attempt to predict the future or forecast where the economy is headed for speculation runs rampant on how the stock market, trade balances, and election results may indicate future economic turmoil or tranquility. This article will instead rely on economic facts and indicators to describe the precise, current economic state. With many worried about the uncertain future ahead, economic or otherwise, this article encourages readers to focus on the present circumstances in order to be better informed about what might occur later.
To organize the flow, we will use a classic economic equation: the equation for aggregate demand. Keynes first described aggregate demand in his pivotal treatise, The General Theory of Employment, Interest and Money, which laid the groundwork for much of macroeconomics during the Great Depression. For those unfamiliar, the aggregate demand equation approximates the aggregate demand (AD) for goods across the entire economy, which is related to income and inflation in the aggregate supply and demand model. At the intersection of the AD model and the short run aggregate supply (SRAS) is the equilibrium gross domestic product (GDP) and price level at a given time. In general, the aggregate demand is equal to the sum total of consumption, investment, and government spending and net exports. By looking into these quantities, one can grasp a simplified version of the dynamics that influence macroeconomic growth and stability, which is why we have segmented this article accordingly.
Although there are many economies that would benefit from an in-depth economic fact check of this type, we will just focus on the United States. This is due to its particularly complex COVID-19 response and the federal government’s onus on states for deciding economic and public health matters. Without further ado, here is a breakdown of the economic state of affairs.
Consumer Spending
“Consumer spending” is defined as spending driven by consumer households for products related to survival and personal utility. It is defined by a function of autonomous consumption spending, disposable income, and the marginal propensity to spend said disposable income. Necessary spending such as food, electricity, and rent payments fall into autonomous consumption, which, by necessity, is less elastic than spending from disposable income. Because many individuals have disposable income, consumer spending can be highly variable and sensitive to economic fluctuations. When economic prospects look dire, people generally begin saving to accommodate the future uncertainty, which causes consumer spending to fall and, in turn, aggregate demand. This leads to a self-fulfilling economic prophecy of reciprocal falls in spending and aggregate demand.
Once state lockdowns began, consumer spending fell sharply. The Bureau of Economic Analysis (BEA) reported that consumer spending fell 12.9% in April and recovered by 8.6% in May and 6.2% in June. This indicates a large recovery of consumer spending, although industry level data from payment transactions paints a slightly different story. Whereas some industries such as health care services seem to have almost entirely recovered, spending on retail, restaurants, and accommodations are down 30–50% from their peak.
In order to ensure the health and safety of citizens, many state governments were required to shut down non-essential businesses. This prevented normal discretionary spending. Even in states that had not ordered shelter-in-place orders, consumer spending still fell as many people were wary to trust public businesses. Travel spending also fell as people cancelled non-essential travel and states mandated quarantining among each other. Even now, many are wary of spending on non-essentials and appear to be delaying spending on large purchases, Deloitte reports.
The common consensus is that fear of catching the virus and economic uncertainty are driving many consumers’ financial decisions at the moment. In Deloitte’s report, roughly 60% of people plan on limiting their public transit and ride-hailing usage for the next six months, 60% do not feel comfortable riding a plane, and 40% do not feel safe staying in a hotel. These numbers are reflected in TSA checkpoint travel numbers, which reports airline travel down over 75% on average since the pandemic began (Figure 1).
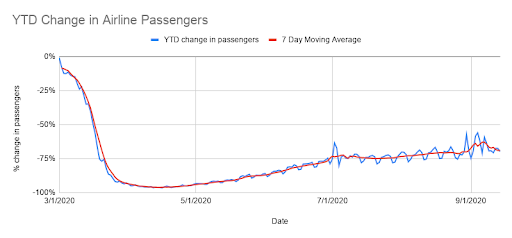
Image Source: TSA
Recreation spending is also sharply down almost 50% as reported by Deloitte. No longer can a group of friends go to dinner, catch a movie, and then hit the bars afterward. All of these industries have struggled to stay in business due to health regulations and the sharp drop in consumer demand. On top of the fact that people are still distrustful of public spaces, restaurants can no longer seat as many customers due to social distancing mandates. Moreover, common weekend staples such as movie theaters, bars, and clubs mostly shut down, preventing consumer spending and challenging the financial viability of these industries in pandemics.
On the other hand, Amazon’s stock price, a crude indicator of online spending, has almost doubled in the past six months. Retail e-commerce skyrocketed 45% year to date in the second quarter of 2020, which indicates a societal move toward e-commerce that has been particularly exacerbated by the pandemic.
Interestingly, real estate prices are appreciating during this pandemic. Home buying spiked over 20% in June, as many people are moving due to the societal shift in the “home” not just as a living space but also as a working space (for non-essential/white collar jobs). This exodus has been most visible in New York, where houses in the suburbs are in short supply yet high demand; in fact, houses there struggle to stay on the market for even a day or two.
Investment Spending
Investment spending is broadly defined as investment by companies on internal projects or durable goods that aim to benefit the company through increased profit or scope. These expenses vary widely in type but are generally focused on research, development, manufacturing, real estate spending, supply chain, and storage.
A unifying feature of investment spending is the general dependence on the effective corporate interest rate. The logical theory behind this is that companies have a variety of projects with varying internal rates of return (IRR) to invest in. If the company has cash, they will only invest if the IRR is greater than the market rate of risk free return, essentially, the rate of multi-year treasury bonds. If the company lacks cash, they will only invest if the IRR is greater than the best corporate loan rate offered. Therefore, if the federal funds rate (FFR) is lowered, the amount of projects with profitable IRR’s increases and general investment spending increases (the reverse is true if the FFR is raised).
That being said, interest rates are now effectively zero. The Federal Reserve Bank (FED) slashed interest rates very early in the pandemic and have maintained them through extensive measures described in the government policy section. While certainly effective in marginally increasing investment spending from the pre-pandemic 1.5% interest rate, the effect is still modest. Larger fiscal policy measures are needed to offset the weakening power of monetary policy due to persistently low interest rates, globalization, and increased forecasting (reported on by the Wall Street Journal, International Monetary Fund, and Bank for International Settlements).
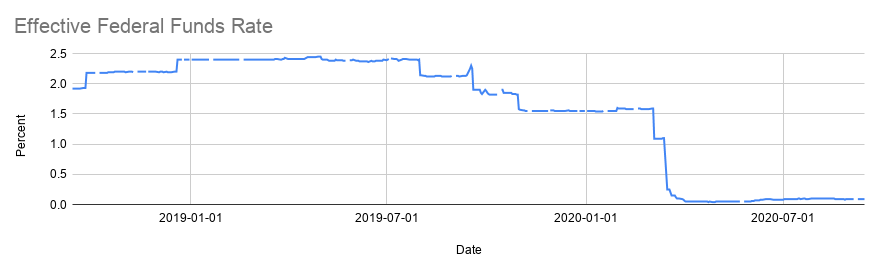 Image Source: FRED
The story is more complex, however, as investment spending also depends on future prospects and long term interest rates. As seen in 2008, dropping interest rates in the short term can lead to a steepening of the yield curve, which can only be remedied by greater FED intervention such as quantitative easing. Figure 3 plots the 5-Year Treasury Bill interest rates, which have changed less (but still significantly) in response to the short term interest rate changes of the FED.
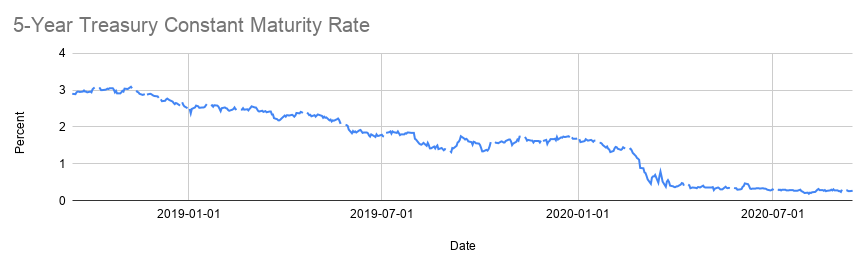 Image Source: FRED
Investment spending is also one of the hardest segments to track due to its often classified nature. Companies maintain a competitive advantage by keeping trade secrets and projects under wraps. The following indications do not represent an exhaustive analysis. One of the most accurate assessments of industry investment are loans given for the express purpose of commercial and industrial investment, which is tracked by the St. Louis Federal Reserve’s economic database (FRED). Figure 4 illustrates the huge jump in investment spending after the FFR was slashed at the beginning of the pandemic.
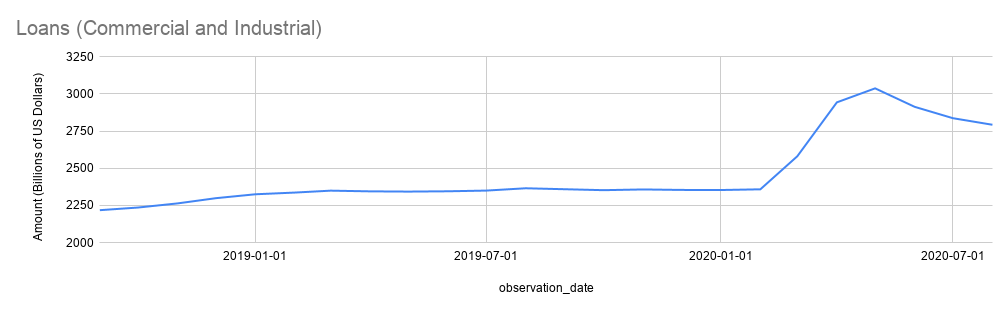 Image Source: FRED
As described earlier, e-commerce has exploded due to the pandemic. To meet demand, retailers and suppliers are pouring money into warehouse space, which has led to a boom in warehouse construction. Warehouse financing has been made easier by the low interest rates available on the market.
Other types of construction have not faulted as much as expected. Many cities granted exceptions to construction projects during the shelter-in-place orders due to the sparse spread of workers. A common bellwether for global construction is the Caterpillar stock price, which has come to surpass its former 2019 high of $148. This dirty approximation is backed up by FRED’s estimate of total construction spending which has dipped only 5% from its pre-pandemic high.
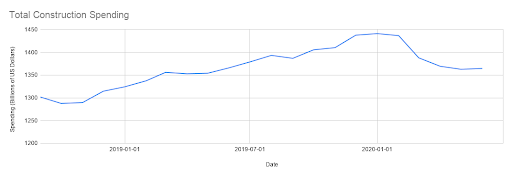 Image Source: FRED
The pandemic has also uncovered a major limitation of “just-in-time” production. While some product shortages are due to panic buying among consumers expecting certain products to run out, most of the pandemic’s product shortages are due to low inventory and limited short run change in production capital. Baker’s yeast, toilet paper, gardening supplies, hand sanitizer, micro-computers, and puzzles have all been sold out in parts of the US due to various supply chain issues and industry’s steady transition to the once popular “just-in-time” model of production. This business model focuses on keeping as little inventory as possible and instead producing a precise amount of a product that exactly matches consumer demand. However, the model is susceptible to failure under large positive demand shocks, which is exactly what happened at the beginning of the pandemic when toilet paper became the first victim of consumer panic buying.
This failure of the “just in time” model has led some to believe companies should shift to a “just in case” model, in which there is enough inventory to both weather demand shocks and dial up or down manufacturing accordingly. This shift in ideology, if accurate, would mandate investment spending in capital in the form of increased inventory, warehousing, and manufacturing capabilities.
Investment spending in supply chains, especially pharmaceutical ones, has increased due to the pandemic. Certain niche businesses such as cold storage warehouses and vaccine containment equipment have seen multi-fold increases to business scale and can hardly keep up. As most supply chains involve multinational investment, this benefit is not US-specific, but it does increase investment spending in some cases.
The apparent disjunction between the stock market and economic reality of COVID-19 may also be of interest to many people. The S&P 500 sank to 65% of its previous peak on March 23rd but in six months has reached a record high once again. This anomaly can be explained by several reasons including the record stimulus package. Regardless, the economic outlook is grim, and the stock market is peculiar to even the most seasoned investors and economists. However, Economists have long warned of the danger of using the stock market as an economic indicator, so this disjunction should be of no surprise. Whereas the stock market is more forward looking in its evaluation of the economy and revenue streams, economic data can often be rear viewing, as it often looks at the consequences of economic activity.
Government Spending
Last March, President Trump signed into effect the Coronavirus Aid, Relief, and Economic Security (CARES) Act, which currently stands as the largest economic aid bill in US history. The CARES Act covers many provisions, including, but not limited to: a small business loan program; many tax credits, deferrals, and exemptions; increased unemployment benefits; directed stimulus checks; and suspension of mortgage and student loan payments.
Of the total $2 trillion in relief from the CARES Act, big businesses and finance firms received the most at $500 billion. The act also dispersed $425 billion to the FED for expanded purchase of underwater asset and repo agreements. $50 billion was given to aid airlines, almost none of which has to be repaid. Airlines then raised money through other capital measures, and the US treasury will undoubtedly be the last to be paid if at all. Luckily, the loans come with caveats stating executive salaries cannot increase, stock buybacks are prohibited, and employee payrolls must be maintained as best as possible until the loan duration is finished.
Small businesses also received a short-lived $350 billion in loans that they were not required to pay back for the purpose of supporting employee payroll for around eight weeks. In just over two weeks, the program ran out of money, and Congress passed a $250 billion extension in response.
Congress also passed an unforeseen provision that granted $300 billion toward individual “stimulus” checks to be directly deposited into every individual’s bank account. These checks dispersed $1,200 to every tax-paying individual that was not claimed as a dependent. The provision was added to bolster consumer spending in response to its dramatic, post-lockdown fall.
$250 billion was granted toward the continuation of state unemployment benefits to individuals that had used up their own benefits or to those that were not previously granted unemployment benefits (e.g. self-employed and gig workers). These provisions allow for 39 weeks of unemployment. Smaller provisions were awarded to state and local governments, the healthcare and agriculture industries, and the Federal Emergency Management Agency.
Unfortunately, many key provisions of the CARES Act have expired or are soon to expire. Extending or proving more benefits requires congressional agreement, but Democrats and Republicans are currently in contention over the relative size of the bill. Democrats are demanding a bill including $2.2 trillion in stimulus, whereas Republicans have proposed a much skinnier bill valued around $600 billion. While the amount of stimulus is of utmost importance, there remains some debate over the exact split of resources and who needs it the most: small businesses, individual Americans, the unemployed, etc.
One of the lesser known sections of CARES Act provides funding for a very unusual project and partnership called “Operation Warp Speed” (OWS). OWS is a joint venture between the Health and Human Services (HHS) Department and the Department of Defense (DoD) to accelerate the vaccine development process to “Warp Speed” and deliver a functional vaccine within the year. The CARES Act provided around $10 billion in funding to invest in R&D projects and distribution channels to ensure not only that a vaccine be developed in record time but also that Americans would be first in line for it. The project chose six life sciences companies to invest in for R&D as well as several more companies that create vaccine distribution supplies. One of these distribution suppliers raised eyebrows since their patented prefilled syringe had scarcely been prototyped before receiving a $138 million dollar investment. While funding transparency is somewhat lacking due to no-bid contracts, the project will be heralded as a success if one of the chosen companies makes the first viable vaccine.
Imports/Exports
Imports and exports also contribute to aggregate demand but are generally overshadowed by other types of spending. The difference between exports and imports (net exports) matters the most to the economy because it defines how much income is flowing in or out of the US to and from other nations. For the past 15 years, the US has sustained a moderate trade deficit of around 5% of GDP. Needless to say, trade and imports have only moderately declined due to COVID (shown in the figure below) and have not contributed significantly to the significant decrease in GDP thus far. In some sectors, the pandemic has increased trade due to highly interconnected global pharmaceutical supply chains and e-commerce demands unusually requested during the pandemic, which include computer parts, board games, and hygiene products.
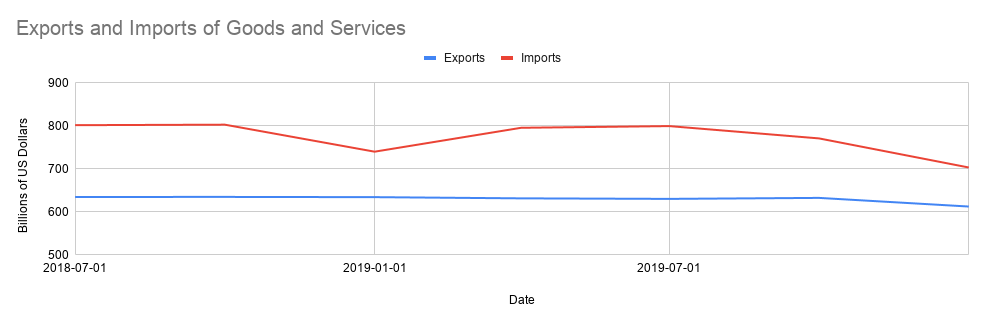 Image Source: FRED
Unemployment and Income
At this point, it should be clear that COVID-19 has aggressively shocked aggregate demand. While government spending has attempted to keep up, the huge shock to consumer spending has resulted in an enormous negative shock to unemployment and income. The following BEA figure on GDP essentially sums up COVID-19’s monumental impact on the US economy.
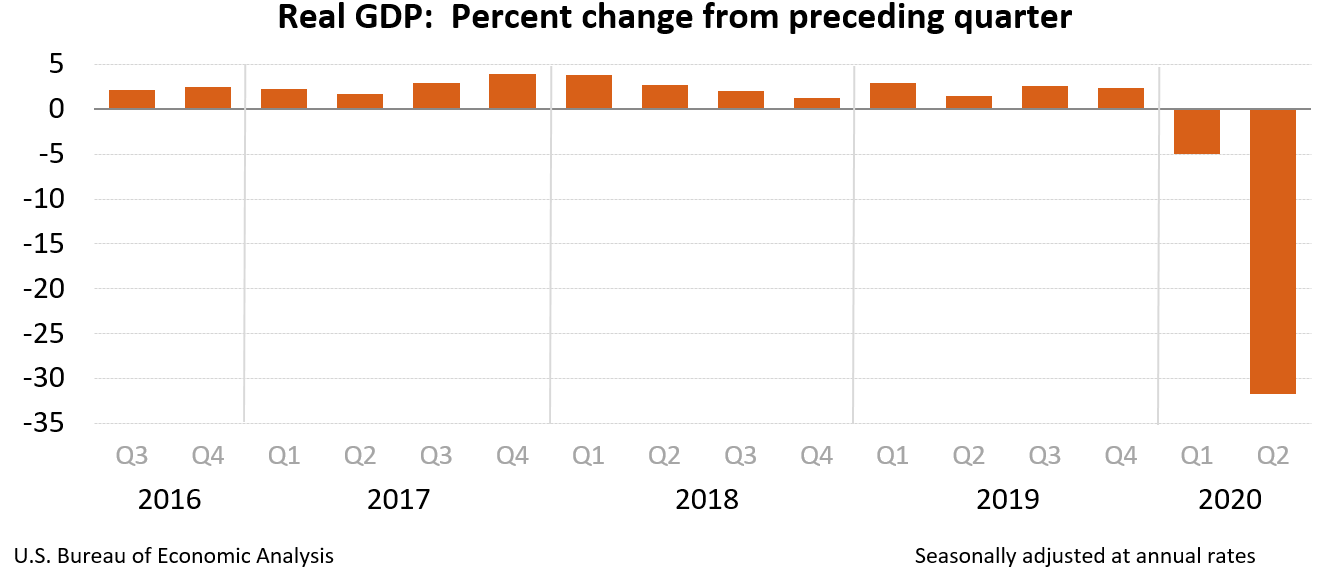 Image Source: BEA
The shock to aggregate demand was immediately internalized by businesses who were forced to lay off droves of people due to decreased revenues. A record amount of almost 40 million unemployment claims have been filed since the beginning of the pandemic, which is more than in any other recession previously. Unemployment also skyrocketed from 3.5% in February to 14.7% in April, as the following figure on unemployment depicts (interactive chart here). The hope is that most of these layoffs are temporary and related to government-mandated lockdowns or closing of non-essential business. However, in no recent history has a forced economic shutdown occurred, so the resulting recession and the effects to unemployment are relatively unpredictable.
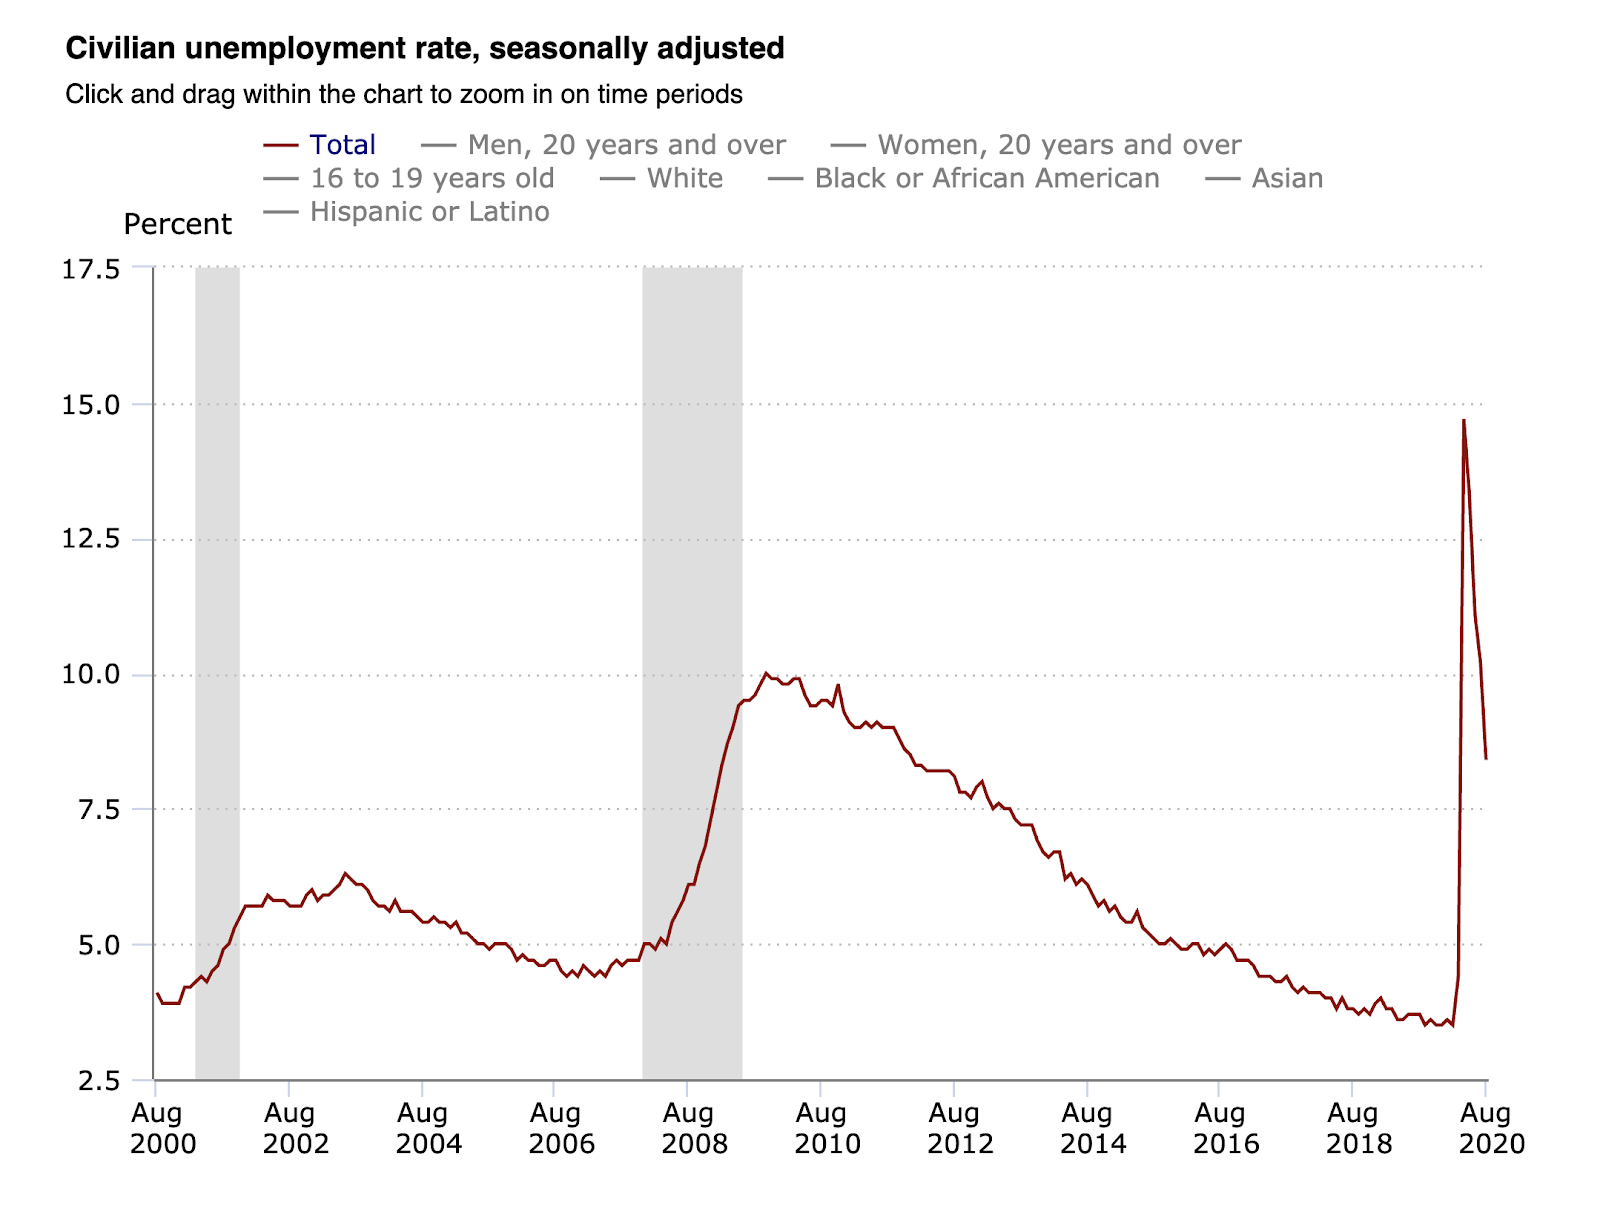 Image Source: BLS
Closing Remarks
While the road to economic recovery is uncertain and likely to be tumultuous, the US government has infused record amounts of cash into the economy to subvert any economic crisis from happening. The effects of these measures seem to have worked very well in the short run and propped up the economy temporarily. That being said, taking record amounts of debt and widening the FED’s balance sheet again are concerning trends to be seen as the US continuously steers away from traditional economic conservatism. In a presidency hallmarked by an appeal to conservative values and a return to what once was, these measures by the US government are quite paradoxical. However, the stimulus has likely saved many people from immediate economic hardship, hunger, and homelessness.
BER will continue to report on the full scale of COVID-19’s economic impact in the future to update readers on the state of the economy. Stay tuned.
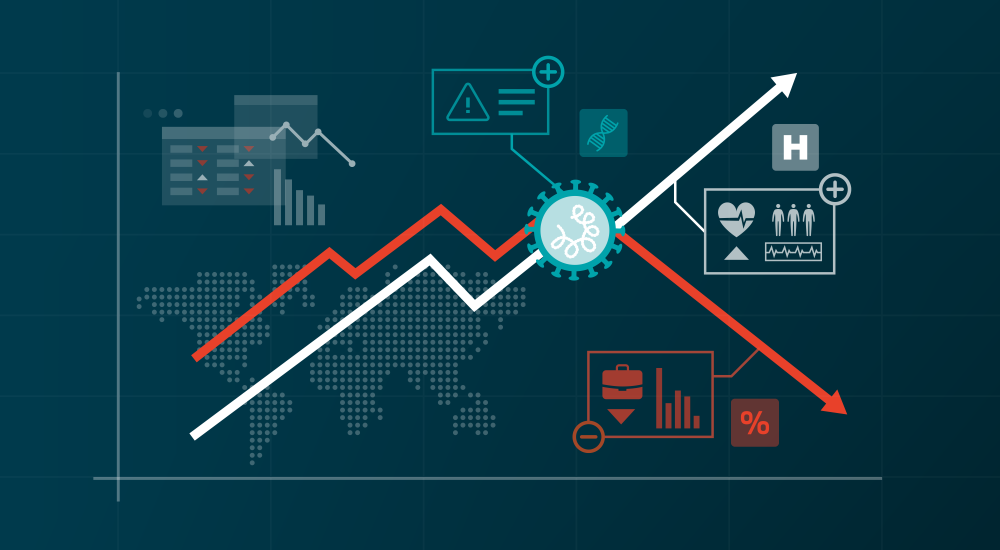
Featured Image Source: Wilson Center
Disclaimer: The views published in this journal are those of the individual authors or speakers and do not necessarily reflect the position or policy of Berkeley Economic Review staff, the Undergraduate Economics Association, the UC Berkeley Economics Department and faculty, or the University of California, Berkeley in general.